Monitoring Apache Cassandra with Prometheus: Integrating Java Exporter and Python Script
- Omkar Kanase
- Aug 24, 2024
- 7 min read

Updated: Aug 27, 2024
Introduction
Apache Cassandra is a distributed NoSQL database designed for handling large amounts of data across many commodity servers without a single point of failure. Due to its distributed nature, monitoring Cassandra becomes crucial to ensure the database's health, performance, and reliability. In this blog, we'll walk through the steps to monitor Cassandra using Prometheus, a powerful monitoring and alerting toolkit, and visualize the data with Grafana.
For those interested in setting up a Apache Cassandra DC & DR, I’ve previously covered the i process in detail. You can find the guide here.
Why Monitor Cassandra?
Monitoring Cassandra is essential for several reasons:
Performance Tuning: Continuous monitoring helps in identifying performance bottlenecks, allowing for optimizations.
Resource Utilization: Monitoring memory, CPU, and disk usage ensures efficient use of resources.
Fault Detection: Early detection of issues like node failures or slowdowns can prevent potential outages.
Scalability: Understanding the workload helps in planning the scaling of the Cassandra cluster.
Why Use Prometheus and Grafana?
Prometheus: An open-source monitoring solution that provides powerful data collection, querying, and alerting capabilities. It's highly suitable for monitoring dynamic cloud environments.
Grafana: A popular open-source visualization tool that integrates well with Prometheus, allowing for the creation of dynamic dashboards.
Architecture Overview
In this setup, we will monitor Cassandra nodes located in both the Data Center (DC) and the Disaster Recovery (DR) site. The specific IP addresses are:
Data Center (DC): 192.168.96.74 (RHEL 8)
Disaster Recovery (DR): 192.168.96.75 (RHEL 8)
To achieve comprehensive monitoring, we will employ the following components:
Java Exporter: This will be used to expose Cassandra metrics such as read/write latency, compaction tasks, and node load. It will be configured on the Cassandra nodes, including the DR machine (192.168.96.75).
Python Script: This script will be responsible for collecting memory usage data from the Cassandra nodes. It will also be set up on the DR machine.
Prometheus: Prometheus will scrape the metrics exposed by the Java exporter and the Python script. It will store this data, which will later be visualized.
Grafana: The data collected by Prometheus will be visualized using Grafana. Grafana will connect to Prometheus to fetch the metrics and display them on customized dashboards, allowing us to monitor the health and performance of the Cassandra nodes.

In this setup, we monitor Cassandra nodes in the Data Center (DC) at 192.168.96.74 and the Disaster Recovery (DR) site at 192.168.96.75 using a Java exporter for Cassandra metrics and a Python script for memory data, all visualized in Grafana via Prometheus, with the DR machine (192.168.96.75) playing a crucial role in monitoring.
Step 1: Setting Up JVM Exporter for Cassandra
1.1 Installing JVM Exporter
The JVM Exporter is used to expose Cassandra metrics to Prometheus.
Download the JVM Exporter:
wget https://github.com/instaclustr/cassandra-exporter/releases/download/v0.9.11/cassandra-exporter-agent-0.9.11.jar /optConfigure Cassandra to Use the Exporter:
JVM_OPTS="$JVM_OPTS -javaagent:/opt/cassandra-exporter-agent-0.9.11.jar=192.168.96.75:8080"
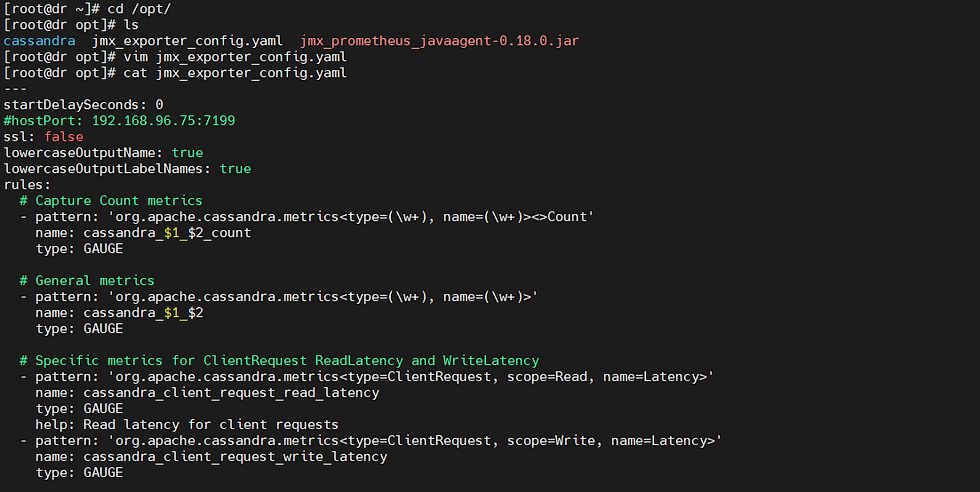
Create a configuration file jmx_exporter_config.yml with the following content:
# /opt/jmx_exporter/config.yaml
---
startDelaySeconds: 0
hostPort: 192.168.96.74:7199
ssl: false
lowercaseOutputName: true
lowercaseOutputLabelNames: true
rules:
  # Capture Count metrics
  - pattern: 'org.apache.cassandra.metrics<type=(\w+), name=(\w+)><>Count'
    name: cassandra_$1_$2_count
    type: GAUGE
  # General metrics
  - pattern: 'org.apache.cassandra.metrics<type=(\w+), name=(\w+)>'
    name: cassandra_$1_$2
    type: GAUGE
  # Specific metrics for ClientRequest ReadLatency and WriteLatency
  - pattern: 'org.apache.cassandra.metrics<type=ClientRequest, scope=Read,  name=Latency>'
    name: cassandra_client_request_read_latency
    type: GAUGE
    help: Read latency for client requests
  - pattern: 'org.apache.cassandra.metrics<type=ClientRequest, scope=Write, name=Latency>'
    name: cassandra_client_request_write_latency
    type: GAUGE
    help: Write latency for client requests
  # Specific metrics for Storage Load and TotalHints
  - pattern: 'org.apache.cassandra.metrics<type=Storage, name=Load>'
    name: cassandra_storage_load
    type: GAUGE
    help: Load on storage
  - pattern: 'org.apache.cassandra.metrics<type=Storage, name=TotalHints>'
    name: cassandra_storage_total_hints
    type: GAUGE
    help: Total hints in storage
  # Keyspace metrics
  - pattern: 'org.apache.cassandra.metrics<type=Keyspace, keyspace=(\w+), name=ReadLatency>'
    name: cassandra_keyspace_read_latency
    type: GAUGE
    help: Read latency per keyspace
    labels:
      keyspace: "$1"
  - pattern: 'org.apache.cassandra.metrics<type=Keyspace, keyspace=(\w+), name=WriteLatency>
    name: cassandra_keyspace_write_latency
    type: GAUGE
    help: Write latency per keyspace
    labels:
      keyspace: "$1"
  - pattern: 'org.apache.cassandra.metrics<type=Keyspace, keyspace=(\w+), name=PendingTasks>'
    name: cassandra_keyspace_pending_tasks
    type: GAUGE
    help: Pending tasks per keyspace
    labels:
      keyspace: "$1"
  - pattern: 'org.apache.cassandra.metrics<type=Keyspace, keyspace=(\w+), name=LiveDiskSpaceUsed>'
    name: cassandra_keyspace_live_disk_space_used
    type: GAUGE
    help: Live disk space used per keyspace
    labels:
      keyspace: "$1"
  - pattern: 'org.apache.cassandra.metrics<type=Keyspace, keyspace=(\w+), name=TotalDiskSpaceUsed>'
    name: cassandra_keyspace_total_disk_space_used
    type: GAUGE
    help: Total disk space used per keyspace
    labels:
      keyspace: "$1"
  - pattern: 'org.apache.cassandra.metrics<type=Keyspace, keyspace=(\w+), name=MeanRowSize>'
    name: cassandra_keyspace_mean_row_size
    type: GAUGE
    help: Mean row size per keyspace
    labels:
      keyspace: "$1"
  - pattern: 'org.apache.cassandra.metrics<type=Keyspace, keyspace=(\w+), name=MaxRowSize>'
    name: cassandra_keyspace_max_row_size
    type: GAUGE
    help: Max row size per keyspace
    labels:
      keyspace: "$1"
Configure Cassandra-env file to Use the JVM Exporter metrics:
# In vim /opt/cassandra/apache-cassandra-4.1.5/conf/cassandra-env.sh
JVM_OPTS="$JVM_OPTS -javaagent:/opt/jmx_exporter/jmx_prometheus_javaagent-0.16.1.jar=8080:/opt/jmx_exporter/config.yaml"
Verify Metrics: Access the metrics endpoint to verify the newly added metrics.
Restart Cassandra:
sh /opt/cassandra/apache-cassandra-4.1.5/bin/cassandra -RAccessing JVM Exporter Metrics on Localhost
The JVM exporter exposes Cassandra metrics on port 8080. To view the metrics, navigate to the following URL in your web browser:

Step 2: Use Python Scripts for Advanced Metrics
Sometimes, the built-in metrics might not cover all the use cases. You can use Python scripts to generate custom metrics.
You can find the Python code for Cassandra monitoring with Prometheus in my GIT repo https://github.com/Omkar8284/Cassandra-Monitoring--Prometheus
Create a Python Script:
Create a Python script that fetches data from Cassandra and exposes it in a format Prometheus can scrape.
vim cassandra_monitor_exporter.py
from prometheus_client import start_http_server, Gauge
import time
import os
# Define the metrics to monitor
dc_status = Gauge('cassandra_dc_status', 'Status of the DC node')
dr_status = Gauge('cassandra_dr_status', 'Status of the DR node')
replication_status = Gauge('cassandra_replication_status', 'Status of data replication between DC and DR')
# Function to check the connection status of a Cassandra node
def check_node_status(ip):
    response = os.system(f"ping -c 1 {ip}")
    return response == 0  # Returns True if the node is up
# Function to check the replication status
def check_replication_status():
    # Implement the logic to check data replication status
    # For simplicity, let's assume it's up if both nodes are up
    return check_node_status('192.168.96.74') and check_node_status('192.168.96.75')
def main():
    # Start the Prometheus serve
    start_http_server(8001)  # Expose metrics on port 8001
    while True:
        # Check and update the status of the DC and DR nodes
        dc_status.set(1 if check_node_status('192.168.96.74') else 0) # mention your dc and dr IPs
        dr_status.set(1 if check_node_status('192.168.96.75') else 0)
        # Check and update the data replication status
        replication_status.set(1 if check_replication_status() else 0)
        # Wait for the next check
        time.sleep(60)  # Ping every 60 seconds
if __name__ == "__main__":
    main()
Run the Python Script:
Start the Python script, which will run an HTTP server on port 8001
python3 cassandra_custom_metrics.pyOutput:

Setting Up systemd Service for Python Script
To ensure the Python script runs as a service to run in detach mode:
Create a systemd service file:
vim /etc/systemd/system/cassandra_monitor_exporter.serviceAdd the following content:
[Unit]
Description=Cassandra Monitor Exporter Service
After=network.target
[Service]
User=root
ExecStart=/usr/bin/python3 /root/cassandra_monitor_exporter.py
WorkingDirectory=/root
Restart=always
[Install]
WantedBy=multi-user.target
Output:

Enable and start the service:
sudo systemctl daemon-reload
sudo systemctl enable cassandra_monitor_exporter.service
sudo systemctl start cassandra_monitor_exporter.service
sudo systemctl status cassandra_monitor_exporter.service
Firewall Configuration:
Allow traffic on port 8001 for the Python script:
sudo firewall-cmd --permanent --add-port=8001/tcp
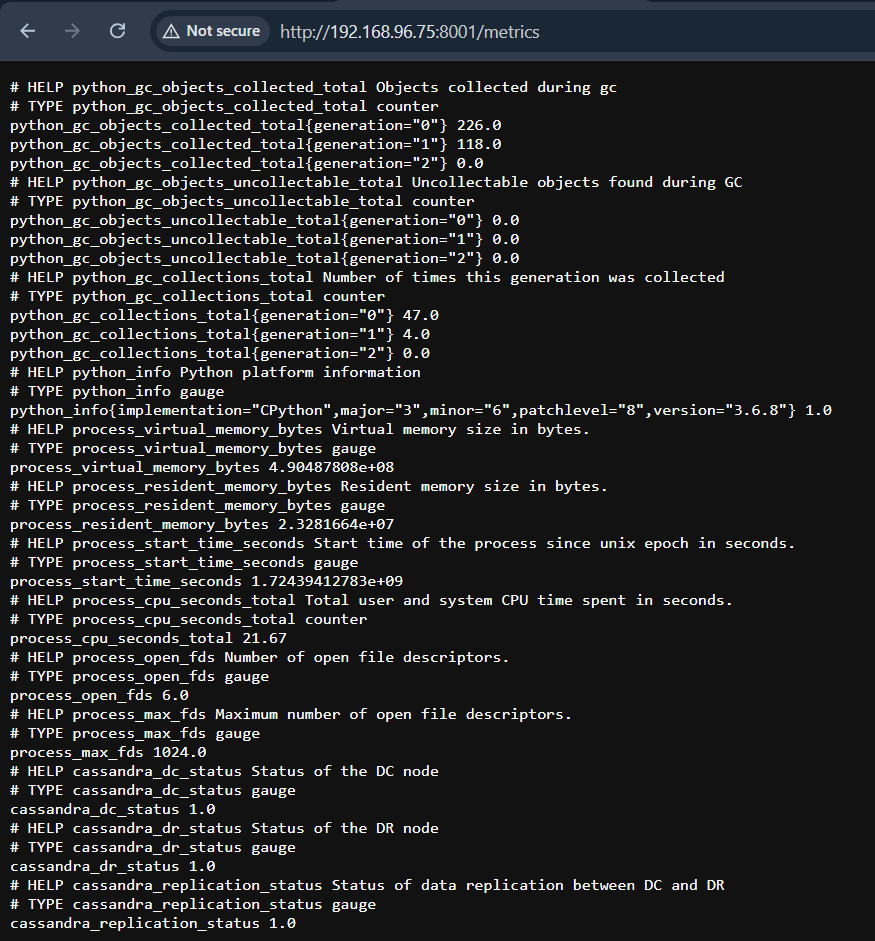
sudo firewall-cmd --reloadAccessing Metrics on Localhost
The Python script exposes the memory usage metric on port 8001. To view the metrics, you can navigate to the following URL in your web browser:
Step 3: Setting Up Prometheus
For a more detailed guide on installing and configuring Prometheus on Linux (RHEL/CentOS/Amazon Linux), you can refer to this article.
Install Prometheus
First, download the latest version of Prometheus.
wget https://github.com/prometheus/prometheus/releases/download/v2.42.0/prometheus-2.42.0.linux-amd64.tar.gz
tar xvfz prometheus-*.tar.gz
cd prometheus-2.47.1.linux-amd64/
2. Configure Prometheus
Create a configuration file prometheus.yml with the following content:
global:
  scrape_interval: 15s  # How often to scrape targets by default
  evaluation_interval: 15s  # How often to evaluate rules
scrape_configs:
  # Scrape configuration for Windows Exporter
  - job_name: 'cassandra'
    scrape_interval: 30s  # Override the global default scrape interval
    static_configs:
      - targets: ['192.168.96.75:8080']  # Replace with the actual host and port of your Windows Exporte
        labels:
          env: 'production'  # You can add custom labels if needed
  # Other scrape configurations can go here
  - job_name: 'ping_exporter'
    scrape_interval: 30s  # Override the global default scrape interval
    static_configs:
      - targets: ['192.168.96.75:8001']  # Replace with the actual IP address and port of your ping_exporter
        labels:
          env: 'production'
3. Set Up systemd Service for Prometheus
Create a systemd service file:
sudo nano /etc/systemd/system/prometheus.serviceAdd the following content:
[Unit]
Description=Prometheus Monitoring System
After=network.target
[Service]
ExecStart=/path/to/prometheus --config.file=/path/to/prometheus.yml
Restart=always
User=your-username
[Install]
WantedBy=multi-user.target
4. Enable and start the service:
sudo systemctl enable prometheus
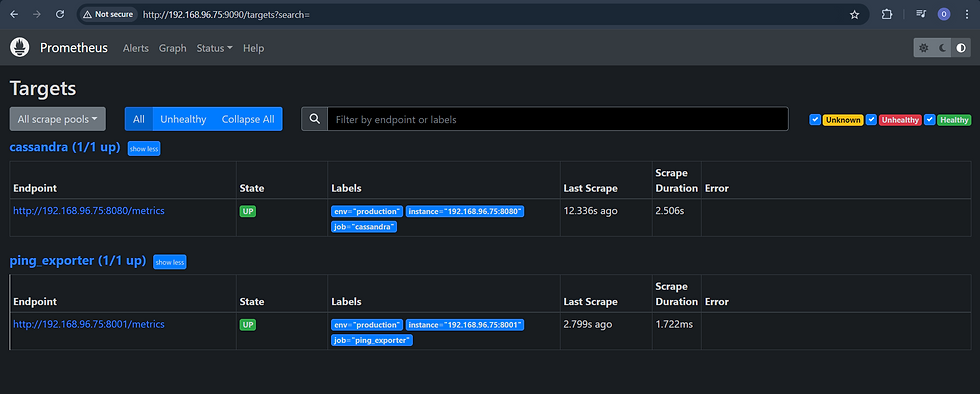
sudo systemctl start prometheus5. Accessing Prometheus on Localhost
Prometheus is accessible on port 9090 by default. To view Prometheus's UI and query metrics, navigate to the following URL in your web browser:
Step 4: Setting Up Grafana
Install Grafana
Use the following commands to install Grafana on Ubuntu:
sudo apt-get install -y software-properties-common
sudo add-apt-repository "deb https://packages.grafana.com/oss/deb stable main"
sudo apt-get update
sudo apt-get install grafana
Start and Enable Grafana
sudo systemctl start grafana-server
sudo systemctl enable grafana-server
Configure Grafana
Access Grafana at http://<your_server_ip>:3000.
Login with default credentials (admin/admin) and add Prometheus as a data source:

Step 5: Visualize Metrics in Grafana
Now that Prometheus is scraping metrics, let’s visualize them in Grafana.
Log in to Grafana:Open Grafana in your browser (http://localhost:3000), and log in with the default credentials (admin/admin).
Add Prometheus as a Data Source:
Go to Configuration > Data Sources.
Click on Add data source and select Prometheus.
Set the URL to http://localhost:9090 and click Save & Test.
Create a New Dashboard:
Go to Create > Dashboard.
Add a new panel and use the metrics collected from your Cassandra servers.
For example:
Cassandra Read Latency:
Use the metric cassandra_client_request_read_latency{...}.
Custom Metric: Use cassandra_custom_metric.
Import Dashboard :
Step 6. Import Grafana Dashboard for Cassandra Monitoring
To streamline the process of visualizing Cassandra metrics, we’ve prepared a ready-to-use Grafana dashboard. You can import this dashboard directly into your Grafana instance.
Grafana Dashboard Import
Dashboard Link:You can access the pre-configured Cassandra Monitoring Dashboard directly via this link: Cassandra Monitoring Dashboard.
Import the Dashboard via JSON: If you prefer to import the dashboard manually, you can use the following JSON code.
Steps to Import:
Log in to your Grafana instance.
Navigate to Create > Import.
Paste the JSON code below or upload it as a file.
Conclusion
Monitoring Apache Cassandra is essential for maintaining its performance and stability, especially in production environments. By following this guide, you have successfully set up a comprehensive monitoring solution using Prometheus and Grafana.
You now have the ability to track Cassandra’s JVM performance, system memory usage, and more, all through intuitive Grafana dashboards. These tools provide real-time insights into your database's operation, allowing you to detect issues early and ensure the continued health of your Cassandra clusters.
Whether you're managing a small cluster or an extensive, distributed environment, this setup will empower you to make data-driven decisions and maintain optimal database performance.
This concludes the blog on monitoring Apache Cassandra using Prometheus and Grafana. With these steps, you're equipped to monitor and manage your Cassandra database effectively.
Happy monitoring!


Comments