Monitoring VMware Clusters using Prometheus and Grafana on RHEL 8
- Omkar Kanase
- Jul 28, 2024
- 3 min read

Updated: Nov 11, 2025
Monitoring VMware clusters is crucial for maintaining the health and performance of your virtualized infrastructure. Prometheus and Grafana are powerful open-source tools that can help you achieve this. In this blog, we will walk through the process of setting up Prometheus and Grafana to monitor VMware clusters using vmware_exporter. Additionally, we'll cover Docker installation on RHEL 8, details about Grafana, and how Prometheus and vmware_exporter work together.
Table of Contents
1. Introduction to Docker
2. Installing Docker on RHEL 8
3. Introduction to Grafana
4. Setting Up Prometheus and vmware_exporter
5. Configuring Grafana to Visualize VMware Metrics
6. Conclusion
1. Introduction to Docker
Docker is a platform that enables developers to automate the deployment of applications inside lightweight, portable containers. Containers provide a consistent runtime environment, which ensures that applications run reliably regardless of where they are deployed.
Prerequisites
In these demo, I’ll be using a RHEL 8 VM, the Docker tool to perform as the engine for the containers I’ll be running. I’ll be using the Docker Compose tool to generate the monitoring environment for the containers.
You can also run the setup using the Docker Compose file. There are two methods, and you can choose the one that is easiest for you.
For a detailed info of VMware ESXi monitoring using Prometheus and Docker Compose, refer to my GitHub repository
2. Installing Docker on RHEL 8
To install Docker on RHEL 8, follow these steps:
Update your system :
sudo dnf update -yAdd the Docker repository :
sudo dnf config-manager --add-repo= https://download.docker.com/linux/centos/docker-ce.repoInstall Docker :
sudo dnf install docker-ce docker-ce-cli containerd.io -y
Start and enable Docker :
sudo systemctl start docker
sudo systemctl enable docker
Verify Docker installation :
sudo docker --version3. Introduction to Grafana
Grafana is an open-source platform for monitoring and observability. It allows you to query, visualize, alert, and understand your metrics no matter where they are stored. With Grafana, you can create, explore, and share dashboards, making it easier to visualize the performance of your systems.
4. Setting Up Prometheus and vmware_exporter
Prometheus is an open-source systems monitoring and alerting toolkit. It collects and stores metrics as time series data, recording information with a timestamp.
vmware_exporter is an exporter for Prometheus that collects metrics from VMware vSphere environments.
To set up Prometheus and vmware_exporter, follow these steps:
1. Create a Docker network
docker network create monitoring2. Run vmware_exporter in a Docker container
Create a config.yaml file with your VMware credentials:
default:
 vsphere_host: "your-vsphere-host"
 vsphere_user: "your-username"
 vsphere_password: "your-password"
Run vmware_exporter :
docker run -d --name vmware_exporter
-v $(pwd)/config.yaml:/config.yaml \
--network monitoring \
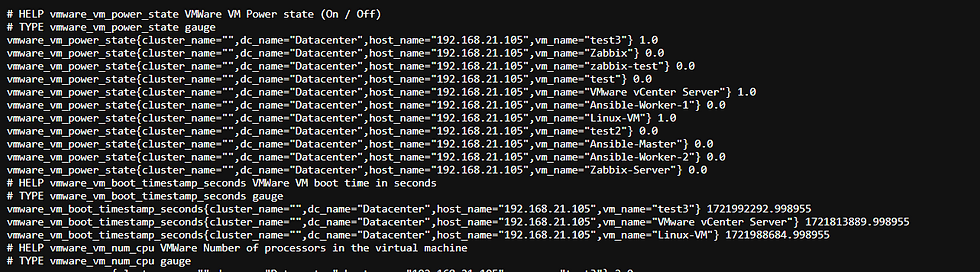
vmware_exporterURL to http://host:9272access vmware_expoter:

CLICK on Metrics show all collecting metrics :
3. Run Prometheus in a Docker container:
Create a prometheus.yml configuration file:
   global:
   scrape_interval: 15s
   scrape_configs:
     - job_name: 'vmware'
       static_configs:
         - targets: ['vmware_exporter:9272']
Run Prometheus:
 docker run -d --name prometheus \
     -v $(pwd)/prometheus.yml:/etc/prometheus/prometheus.yml \
     --network monitoring
     -p 9090:9090 \
     prom/prometheus
URL to http://host:9090 Prometheus:

5. Configure using the Docker Image:
vim docker-compose.ymlversion: "3"
services:
prometheus_server:
image: prom/prometheus:v2.17.0
volumes:
- type: volume
source: prometheus_data
target: /prometheus
- /opt/prometheus.yml:/etc/prometheus/prometheus.yml
ports:
- 9090:9090
privileged: true
grafana_server:
image: grafana/grafana:v10.0
volumes:
- type: volume
source: grafana_configuration
target: /etc/grafana
- type: volume
source: grafana_data
target: /var/lib/grafana
ports:
- 3000:3000
privileged: true
vmware_exporter:
image: pryorda/vmware_exporter:v0.11.1
ports:
- 9272:9272
environment:
VSPHERE_HOST: <HOST_IP>
VSPHERE_IGNORE_SSL: True
VSPHERE_USER: <USER>
VSPHERE_PASSWORD: "<PASSWORD>"
volumes:
prometheus_data:
grafana_configuration:
grafana_data:
After you inspected the configuration, you are ready to deploy the environment! Use the docker-compose utility to bring your environment up.
sudo docker-compose up -dMake sure that the containers are running. 3 containers should be up.
sudo docker ps6. Configuring Grafana to Visualize VMware Metrics
1. Run Grafana in a Docker container :
   docker run -d --name grafana \
     -p 3000:3000 \
     --network monitoring \
       grafana/grafana
2. Access Grafana :
Open your browser and go to http://<your-server-ip>:3000. Log in with the default credentials (admin/ admin).
3. Add Prometheus as a data source:
- Go to Configuration > Data Sources.
- Click Add data source and select Prometheus.
4. Import a dashboard:
- Go to Create > Import.
- Enter the dashboard ID or upload a JSON file of a Grafana dashboard for VMware metrics.
- Select Prometheus as the data source and click Import.


6. Conclusion
By following these steps, you can set up a robust monitoring solution for your VMware clusters using Prometheus and Grafana on RHEL 8. Docker simplifies the deployment of these services, making it easier to manage and scale your monitoring infrastructure. With Grafana, you can create insightful dashboards that help you keep an eye on the performance and health of your VMware environment.
Happy monitoring! If you have any questions or need further assistance, feel free to reach out.


Comments